November 13, 2026
Double Top Pattern in Crypto: Reading the Neckline
How a double top forms on a crypto daily chart and where the neckline sits, with a real LTC example (peaks 75 and 72.3, neckline 65.63), Oct 2026.
Free accounts can browse daily and weekly scans and keep a 5-coin watchlist. Create a free account.
What a double top looks like on a daily chart
A double top is a chart pattern made of two peaks at similar price levels, with a trough between them. It appears on crypto charts of any timeframe. The horizontal level drawn through that trough is the neckline, and it is the level the pattern is read against.
On a crypto daily chart each candle is one UTC day, so the two peaks usually sit days or weeks apart. They do not need to match exactly. LuminaAnalysis allows the two peaks to differ by up to 4%. Beyond that, the structure is no longer treated as a double top. The double top and double bottom guide lists the full set of checks.
Where the neckline sits
The neckline is not drawn through the peaks. It is drawn horizontally through the lowest point of the trough between them. While price stays above that level, the pattern is still unconfirmed: it is only two peaks and a trough.
What counts as a close below the neckline
A close below the neckline means a daily candle closed at a price lower than the neckline. A wick that dips under the neckline but closes back above it does not count. Closes are used because a single intraday spike can pierce a level without price settling beyond it.
This is a definition, not an instruction. A close below the neckline describes what price did. It does not say what price will do next.
A worked example: LTC in October 2026
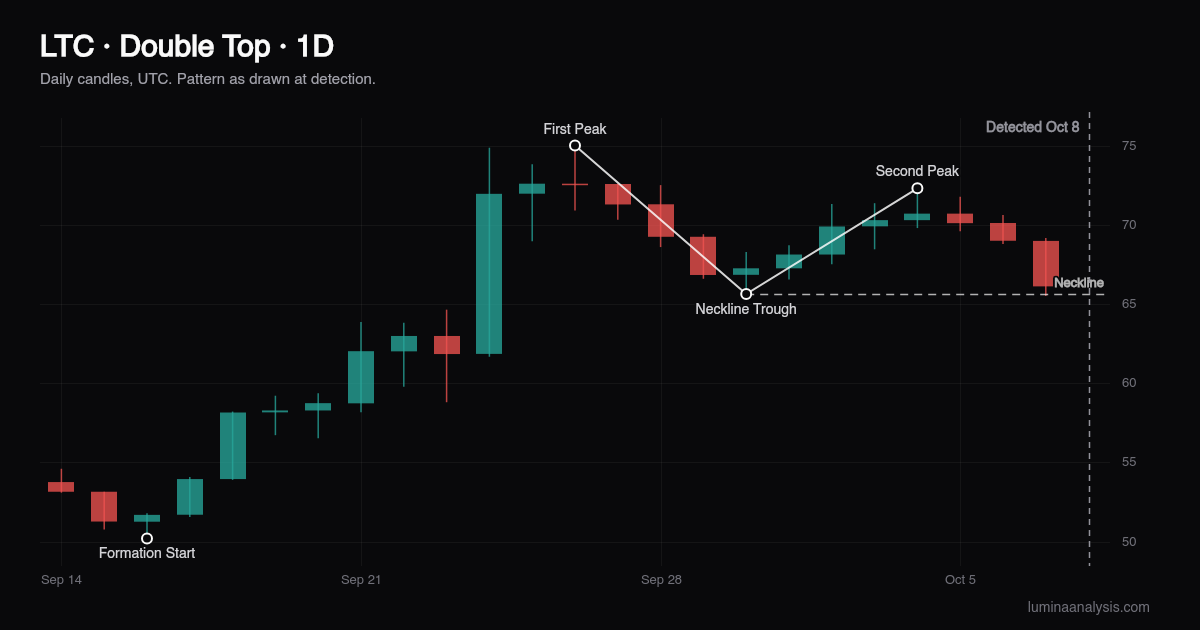
On Oct 8, 2026, LuminaAnalysis detected a Double Top on the LTC daily chart. These are the setup facts, all known on the detection day:
- First peak: 75 on Sep 26.
- Trough, which sets the neckline: 65.63 on Sep 30.
- Second peak: 72.3 on Oct 4.
- Gap between the two peaks: 3.67%, measured against their average, inside the 4% limit.
- Price at detection: 66, which was 0.56% above the neckline.
What follows is the disclosed record after detection. The detection-day candle on Oct 8 fell 4.45% from open to close and closed at 63.16. That was the first daily close below the neckline, 3.76% under the 65.63 level, and it happened on the detection day itself.
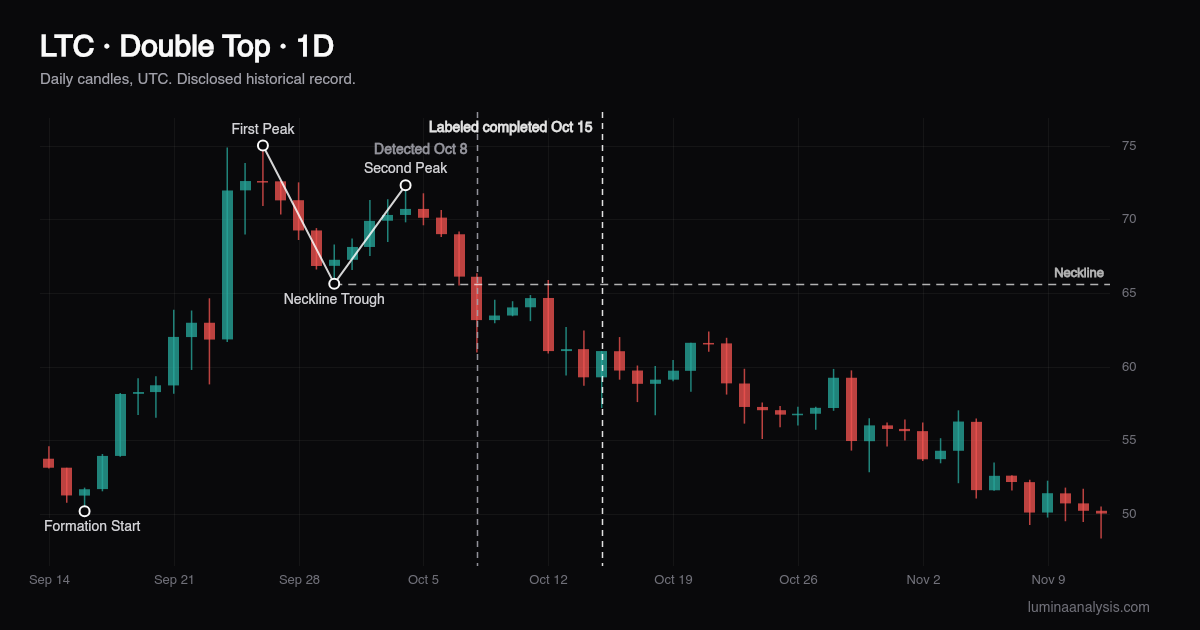
Six fully closed daily candles followed, from Oct 9 through Oct 14. None traded above the detection price: the highest high was 65.88 on Oct 12, 0.18% below 66. The lowest close was 59.28 on Oct 14, 10.18% below the detection price. The figures in this section run only through the recorded resolution, while the chart continues to the latest daily close at the time of writing.
The case was recorded as completed on Oct 15 at a price of 59.23, which is 10.26% below the detection price. The recorded date can lag the actual move, so it should not be read as how long the pattern needed.
What this example does and does not show
It shows how a neckline reads on a real chart: peaks at 75 and 72.3, a neckline at 65.63, price just above that level at detection, and a daily close below it on the same day. It is one case on one coin. It does not show how often a double top works, and it says nothing about the next detection.
The completed label means price reached the pattern's completion zone before it breached the invalidation level, the structural level that would undermine the pattern. It describes the path price took after detection, not a forecast. Several other large coins also declined over the same weeks, so this case is not evidence about double tops in general. The full disclosed history for daily Double Top patterns, 14 resolved cases, is on the track record page with every outcome shown.
How close do the two peaks need to be?
LuminaAnalysis allows up to 4% between the two peaks. In the LTC example the gap was 3.67%. A wider gap describes a different structure, such as a higher high followed by a lower high.
Does a double top always lead to a decline?
No. A double top describes a shape that has formed. It does not forecast what price does next. Price can hold above the neckline, or recover after a close below it. Every resolved daily Double Top case is listed on the track record page, whether it completed or failed.
Should a double top be read on the daily or the weekly chart?
The structure is the same on any timeframe. LuminaAnalysis scans the daily and weekly charts automatically each day. A weekly double top takes longer to form because each candle covers seven days. This article uses the daily chart.